
User Experience Help Guide: How to Fix Quit Risk & Keep Visitors Longer
Discover the exact UX and SEO factors that make users bounce in seconds and learn step-by-step fixes using Traffic Torch’s free Quit Risk Tool.
In this complete help guide you’ll learn what each module really measures, how the tool calculates scores, why it matters for modern SEO + UX, and the fastest fixes that deliver the biggest wins. Ready to turn leavers into loyal readers and buyers?
Test your UX Quit Risk score.
Run an instant user experience analysis on Traffic Torch.
Free UX Audit Tool →Frequently Asked Questions
What exactly is "quit risk"? +
Quit risk estimates how likely visitors are to leave your page quickly (usually within 10–30 seconds) due to UX or technical friction. Traffic Torch calculates it from real behavioral patterns tied to readability, navigation, accessibility, mobile experience, and speed.
How accurate is the Traffic Torch Quit Risk Tool? +
It uses industry-standard metrics (Flesch formulas, WCAG 2.2 AA signals, Core Web Vitals patterns, touch-target guidelines) combined with realistic thresholds derived from analyzing thousands of live pages. When you audit a live URL, the numbers come from a real browser render — actual transfer sizes, computed contrast ratios, and measured touch targets — not just static HTML. While not a full Lighthouse audit, it delivers highly actionable insights focused on quit-risk triggers.
Can it help e-commerce or lead-generation sites? +
Yes - especially. It flags CTA visibility, mobile touch targets, load speed, and navigation flow - all critical for conversions. Many e-commerce sites see immediate bounce-rate drops after fixing the top-priority issues the tool highlights.
How soon will I see results after making fixes? +
Most sites notice better engagement metrics (lower bounce, higher time on page) within 1–4 weeks, depending on traffic volume. Core ranking improvements usually appear in 4–12 weeks once Google recrawls and re-evaluates behavioral signals.
Webpage Readability for SEO & UX
What is Readability?
Readability measures how easily visitors can understand and scan your content on any device. It combines classic formulas (Flesch Reading Ease, Flesch-Kincaid) with modern web scannability signals: short sentences, concise paragraphs, bold text, lists, subheadings and visual hierarchy.
High readability keeps people reading longer. Low readability causes almost immediate bounces, especially on mobile where most traffic arrives.
How does Traffic Torch measure Readability?
When you audit a live URL, Traffic Torch renders the page in a real browser and extracts the visible rendered word count from the live DOM. That number is treated as ground truth, and the classic formula inputs (sentences, syllables, paragraph density) are scaled against it so nested layout containers don’t double-count the same text. The tool then runs industry-standard calculations:
- Flesch Reading Ease Score
Formula: 206.835 − (1.015 × avg sentence length) − (84.6 × avg syllables per word).
Target: 60–70+ for general web audiences (higher = easier to read). - Flesch-Kincaid Grade Level
Estimates U.S. school grade needed to understand the text.
Target: Grade 8 or lower (most top-ranking content aims for 7–9). - Average Sentence Length
Ideal: under 20 words. Sentences consistently over 25 words lower the score. - Paragraph Density & Length
Flags walls of text. Best practice: 3–4 sentences max per paragraph on mobile. - Overall Text Scannability
Counts use of bold/strong, bullet/numbered lists, descriptive subheadings relative to the rendered word count. Strong hierarchy boosts the final score significantly.
Passing threshold in Traffic Torch: 65+. When auditing pasted HTML (no browser render), the tool falls back to static DOM text extraction — scores remain comparable but may differ slightly from a live audit.
Why does Readability matter for SEO & UX?
Poor readability is one of the fastest ways to trigger a bounce. In 2026 users decide to stay or leave in under 10 seconds. Dense text loses almost everyone on mobile.
Google’s people-first content update and tightened E-E-A-T guidelines reward clear, approachable writing. Readable pages deliver:
- ↑ 30–50% longer session duration (Nielsen Norman benchmarks).
- ↓ 20–40% bounce rate reduction after fixes.
- → Wider audience reach (≈50% of adults read below grade 8 level).
- ★ Stronger E-E-A-T signals = better trust & ranking potential.
- 📱 Improved mobile engagement & voice-search compatibility.
For official guidance on writing for the web and readability best practices, see Google's Writing for People, not Search Engines and the Web.dev Readability guide .
Quick Wins Checklist
- • Target grade 7–8 reading level.
- • Keep average sentence length under 20 words.
- • Limit paragraphs to 3–4 sentences max.
- • Use bold for key phrases and bullets for lists.
- • Front-load the most important information (inverted pyramid).
- • Prefer active voice and short, common words.
Website Accessibility for UX and SEO
What is Accessibility Health?
Accessibility Health measures how inclusive your website is for people with disabilities. It checks whether screen readers, keyboard navigation, color-blind users, low-vision users and motor-impaired visitors can use your page effectively.
Good accessibility serves 15–20% of the population that live with some form of impairment, and many accessibility improvements also boost SEO and general user experience.
How does Traffic Torch measure Accessibility?
The tool scans your page’s DOM and, for live URLs, uses computed styles from a real browser render to calculate actual WCAG contrast ratios. It looks for these WCAG 2.2 AA compliance signals:
- Alt Text Coverage
Counts meaningful images without descriptive alt text. Decorative images (role="presentation" or empty alt) are excluded. Raw counts of missing / meaningful / decorative images are surfaced so you know exactly what to fix.
Target: 100% coverage on informative images; missing alts heavily penalize the score. - Color Contrast Ratios
For live URLs, contrast is measured from the rendered page: the tool walks actual text elements, resolves effective background colour up the ancestor chain, and calculates the real contrast ratio. Normal text ≥4.5:1, large text ≥3:1 per WCAG AA.
When auditing pasted HTML (no render), a conservative estimate is used instead and flagged accordingly. - Semantic HTML Structure
Weights a real<main>most heavily, then<article>/<section>, landmark roles, and a heading hierarchy that uses multiple levels — not just any heading count. One H1, logical H Tag order.
Semantic markup helps screen readers and search engines understand page structure. - Overall WCAG Compliance Indicators
Looks for ARIA labels, landmark roles and common failure patterns. Combines automated signals into a realistic compliance estimate (full manual testing still recommended for perfection).
Passing threshold in Traffic Torch: 78+. Scores prioritise high-impact issues that affect real users the most. Contrast results now reflect the actual rendered page, so a low score means real users are seeing low-contrast text.
Why does Accessibility matter for UX & SEO?
Google explicitly states that accessibility helps SEO: semantic structure improves crawlability, better contrast aids readability signals, and inclusive experiences reduce bounce rates while increasing dwell time. Strong accessibility delivers:
- ↑ Reach to 15–20% more users (people with disabilities).
- ↓ Lower bounce rates from frustrated users.
- → Stronger semantic signals → better topical understanding by Google.
- ★ Improved E-E-A-T perception (expertise, experience, authoritativeness, trustworthiness).
- 🛡️ Reduced compliance risk in many countries.
Follow the official Web Content Accessibility Guidelines (WCAG 2.2) from the W3C — start with the WCAG 2.2 Quick Reference and Web Devs Making your site accessible guide.
Quick Wins Checklist
- • Add meaningful alt text to every informative image (concise & descriptive).
- • Ensure text contrast meets at least 4.5:1 for normal text.
- • Use semantic HTML: one h1, logical h tag order, main, nav, article.
- • Add ARIA labels where native semantics are missing (e.g., icons, custom buttons).
- • Make all interactive elements keyboard-focusable and visible on focus.
- • Test with free tools like WAVE or Lighthouse regularly.
Boost your UX score.
Ready to slash quit risk and keep more visitors?
Run the Free UX Analysis Tool →Webpage Performance for UX and SEO
What is Performance Health?
Performance Health measures how fast and efficiently your page loads and renders. It flags heavy assets, render-blocking resources, unoptimized images, bloated scripts, font issues and missing lazy-loading. All these factors that directly affect user patience and perceived quality.
Speed is a top quit-risk trigger. Even one extra second of load time can increase bounce rates by 32% (Google data still valid in 2026).
How does Traffic Torch measure Performance?
For live URLs, the tool reads real transfer sizes from the browser’s Performance Resource Timing API — not just counts of tags. Thresholds are calibrated against HTTP Archive medians (≈1.6 MB total, ≈350 KB script, ≈900 KB images, ≈90 KB fonts). For pasted HTML (no browser render), it falls back to count-based heuristics.
- Asset Volume & Optimization Flags
Uses real total-transfer bytes where available, plus image count pressure. Flags pages that exceed reasonable weight for modern web audiences.
Targets: aggressive compression, next-gen formats (WebP/AVIF), server compression (Brotli/GZIP). - Script Bloat & Render-Blocking Detection
Measures real script transfer bytes when available. Render-blocking is classified from the browser’srenderBlockingStatusAPI (authoritative), with a head-only attribute fallback. Only<head>resources count — bottom-of-body scripts no longer penalize.
Best practice: defer/async non-critical JS, minify/bundle, remove dead code — aim for ≤2–3 small blocking resources. - Font Optimization
Counts unique font families actually used on the rendered page (from computed styles), not font stylesheet links. Combines with real font byte weight when available. Detectsfont-display: swap.
Ideal: ≤2–3 families, font-display: swap, preload critical fonts, prefer system fonts when possible. - Lazy Loading & Image Optimization
Recognises nativeloading="lazy"plus JS-driven lazy-loaders (data-src,data-lazy,data-srcset,class="lazy") so real-world patterns count. Modern-image ratio comes from real MIME data captured during render, not just the.webp/.avifextension in HTML — CDN-served modern formats are now credited.
Missing lazy-loading or oversized images heavily penalize the score.
Passing threshold in Traffic Torch: 82+. The module emphasises issues that most directly cause early user abandonment.
Why does Performance matter for SEO & UX?
Slow pages are the #1 technical reason users quit. Google’s Core Web Vitals (LCP, INP, CLS) remain ranking factors in 2026, and real-user speed strongly influences behavioral signals (bounce rate, dwell time, pogo-sticking).
Faster sites feel more professional, keep users engaged longer, and convert better. Excellent performance delivers:
- ↑ 20–50% longer average session duration.
- ↓ Up to 32% bounce rate reduction per second saved (Google benchmarks).
- → Direct positive impact on Core Web Vitals rankings.
- ★ Higher conversion rates (often 7–20% lift per second faster load).
- 📈 Stronger mobile rankings and overall perceived site quality.
Google’s official performance documentation is available in the Core Web Vitals overview and the comprehensive Web.dev Performance Learning Path .
Quick Wins Checklist
- • Convert images to WebP or AVIF and compress aggressively (Under 100 KB ideal per image).
- • Add loading="lazy" to all offscreen images and iframes.
- • Defer or async non-critical JavaScript; minify and bundle JS/CSS.
- • Limit font families to 2–3 and use font-display: swap.
- • Preload critical fonts and hero images with
<link rel="preload">. - • Enable Brotli or GZIP compression on your server/CDN.
Mobile & PWA Readiness for SEO and UX
What is Mobile & PWA Readiness?
Mobile & PWA Readiness checks how well your page performs and adapts on smartphones and tablets. It evaluates viewport setup, responsive design quality, touch-friendliness, and progressive web app features that make sites feel more like native apps.
Mobile is no longer optional - it is the majority of web traffic. Poor mobile experience causes instant bounces, while strong mobile + PWA signals improve engagement, return visits and SEO rankings.
How does Traffic Torch measure Mobile & PWA Readiness?
For live URLs, the tool measures from a real browser render — actual viewport size, real element rectangles, and real resource presence. For pasted HTML it falls back to DOM inspection.
- Viewport Configuration
Checks for the correct meta tag:<meta name="viewport" content="width=device-width, initial-scale=1">. Also flags zoom-blocking (maximum-scale=1,user-scalable=no). If a meta tag is missing but the page was rendered at a reasonable width, a partial credit is given — pages that reflow without a tag aren’t penalised as harshly as fixed-width pages. - Responsive Breakpoints & Layout
Looks for real responsive signals — presence of media queries plus the actual rendered viewport the worker observed — rather than the old "any stylesheet exists" test. Penalises horizontal overflow and fixed-width content. - Touch Target Size
Uses real measured rectangles from the live browser render: every anchor, button androle="button"element is measured, and the ratio of too-small targets (<44×44 px) drives the sub-score. When no render data is available (pasted HTML), this factor is treated neutrally rather than guessed. - PWA Readiness Indicators
Builds a 0–100 sub-score from real signals: valid web app manifest, service worker registration hints, HTTPS, Apple touch icon, plus a mobile-first-build proxy (modern viewport + accessible touch). Strong PWA features enable add-to-home-screen prompts and offline potential.
Passing threshold in Traffic Torch: 80+. Scores heavily weight viewport and touch usability as they cause the most immediate user pain.
Why does Mobile & PWA Readiness matter for SEO & UX?
Mobile issues remain one of the highest quit-risk factors in 2026. Google has used mobile-first indexing since 2019. If your site fails on phones, rankings suffer across all devices.
Core Web Vitals, page experience signals and user behavior metrics all favor fast, touch-friendly, installable experiences. Excellent mobile & PWA readiness delivers:
- ↑ 30–60% longer sessions on mobile devices.
- ↓ Significant bounce rate drop (often 25–50% after fixes).
- → Mobile-first indexing advantage + better Core Web Vitals scores.
- ★ Higher return visits via PWA install prompts (up to 36% more engagement per Google studies).
- 📱 Stronger user trust and perceived site quality.
Google’s mobile-first indexing and PWA guidelines are detailed in the Mobile-first Indexing documentation and the official Progressive Web Apps guide on Web.dev .
Quick Wins Checklist
- • Add or fix the viewport meta tag exactly: width=device-width, initial-scale=1.
- • Use mobile-first CSS with relative units and proper media queries.
- • Ensure buttons and links are at least 44×44 pixels with 8px+ spacing.
- • Create a valid manifest.json with name, short_name, icons and theme_color.
- • Register a basic service worker (even minimal caching improves perceived speed).
- • Test on real phones - avoid relying only on browser dev tools.
Putting It All Together and Lower Your Quit Risk
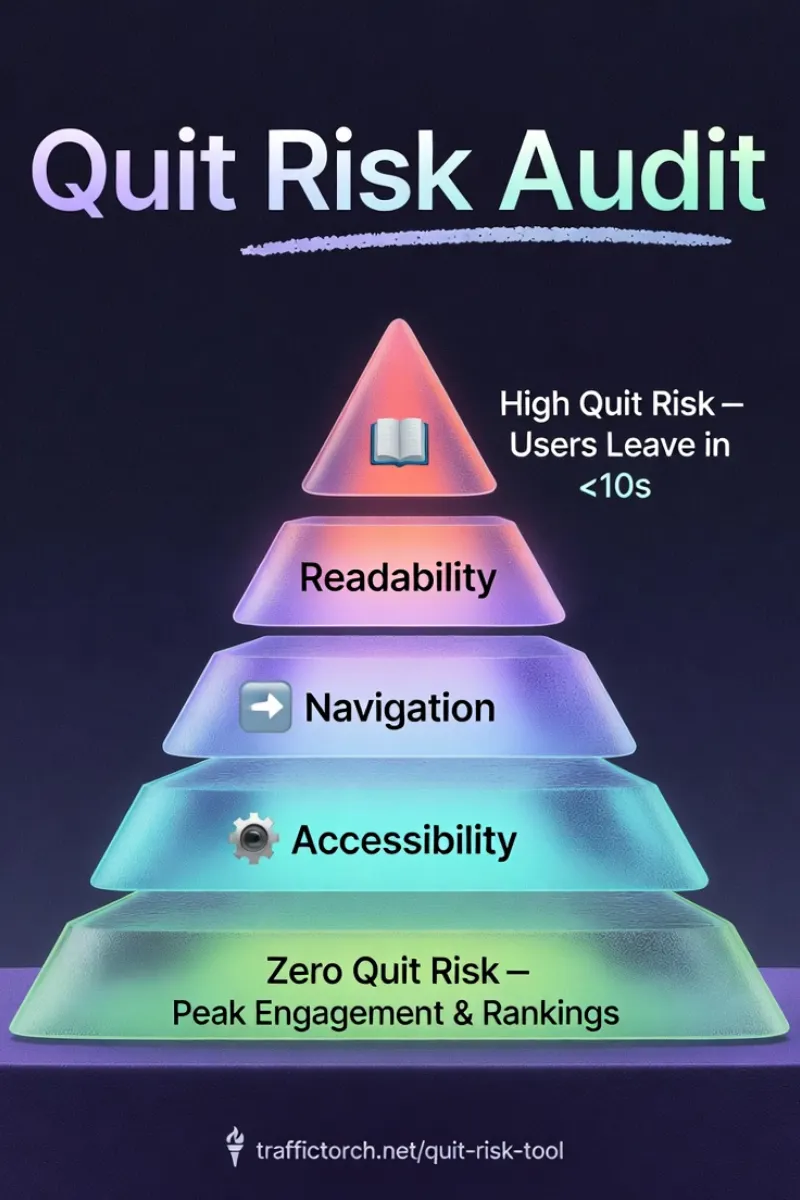
Quit risk is not a mystery, it is the combined effect of five clear areas: readability, navigation, accessibility, mobile readiness, and performance. When any one of these drops, users leave fast. When all five improve, engagement soars, bounce rates fall, and Google rewards the better user experience with stronger rankings.
The best part? You do not need expensive audits or months of work. Traffic Torch’s free Quit Risk Tool gives you an instant 360° health score across every module - with realistic metrics, prioritized fixes, and estimated impact on bounce rate and conversions.
Start small: fix one high-impact issue from any module. Track the change in Google Analytics (exit rate, session duration, pages per session). Most sites see noticeable gains within 1–4 weeks.
Your visitors deserve a fast, clear, inclusive, and mobile-friendly experience. Give it to them - and watch retention and rankings climb.

Ready to slash quit risk and keep more visitors?
Run A Free Quit Risk Scan →